Building Clinical Insight with Tableau: ABG Analysis in Sepsis

Updated: Jan 12
Let’s understand the clinical terminologies before getting into more details.
What is Sepsis?
Sepsis is a life-threatening condition where the body's response to an infection triggers a damaging inflammatory reaction that can lead to organ dysfunction and death.
It is caused by infections (bacterial, viral, or fungal) non-infectious insults like trauma. The disease progresses through stages
Different Stages in Sepsis
Stage 1: Sepsis
Initial systemic inflammatory response to the infection.
Stage 2: Severe Sepsis
The body's organs begin to fail.
Stage 3: Septic Shock
A critical, life-threatening condition where blood pressure is dangerously low and organ failure is likely.
What is ABG (Arterial Blood Gas)?
An Arterial Blood Gas (ABG) is a blood test measuring oxygen (O2), carbon dioxide (CO2), and acid-base balance (pH) from an artery, revealing how well lungs oxygenate blood and how the body regulates acidity/alkalinity, crucial for diagnosing lung, heart, and metabolic issues by assessing ventilation and oxygenation status.
Correlation between Sepsis and ABG (Arterial Blood Gas)
Sepsis Affects the body’s organs and metabolism
As sepsis progresses, it can impair lung function, circulation, and cellular metabolism. This can lead to problems with oxygen delivery and carbon dioxide removal.
ABG Reveals the impact of sepsis
By measuring O2, Co2, and PH, ABG analysis helps clinicians detect respiratory failure, Metabolic Acidosis (a buildup of acid in the blood) and other complications that commonly occur in Sepsis
Guiding treatment
ABG results are crucial for diagnosing the severity of sepsis, monitoring organ function, and guiding interventions such as oxygen therapy, mechanical ventilation, and correction of acid-base imbalances.
Key Takeaways
ABG analysis is an essential diagnostic tool in the management of sepsis. It provides real-time information about respiratory and metabolic status, helping healthcare providers understand how sepsis is affecting the body and what treatments are needed.
ABG Analysis Dashboard
This blog walkthrough the dashboard design, the clinical reasoning behind each chart, and how healthcare teams can use it for rapid decision‑making.
Imagine trying to piece together the story of sepsis from scattered lab results and dense textbooks. This dashboard changes the game! This dashboard was built to bridge that gap.
Get a visual, step-by-step tour of acid–base physiology. Complex concepts become clear, interactive, and memorable—no more flipping through confusing textbook pages.
The goal is simple - Make sepsis severity and ABG interpretation easier to grasp, teach, and use in real life.
Ready to explore? In the sections ahead, you’ll see how each visualization brings clarity to one of the toughest challenges in critical care—and how smart data design can turn complexity into confidence.
Click here to refer the sample data set used to build this dashboard
In this analysis, below biomarkers from the sample data were used
Ph
PaCO2
Hco3
O2Sat
SaO2
Chart 1: ABG Analysis Patients Count
List of calculated fields used in this chart
ABG Count
([P H]<7.35 OR [P H]>7.45) AND
([PaCO2]<35 OR [PaCO2]>45) AND
([Hco3]<22 OR [Hco3]>26) AND
([O2Sat]<100) AND
([SaO2]<100)
ABG 1
if [ABG Count]=TRUE then [Patient ID] END
ABG 2
COUNTD([ABG 1])
In mark card change Automatic in Text and drop ABG 2 (Calculated Field) into text and add customized Image into shapes
Visualization of ABG Analysis Patients Count chart

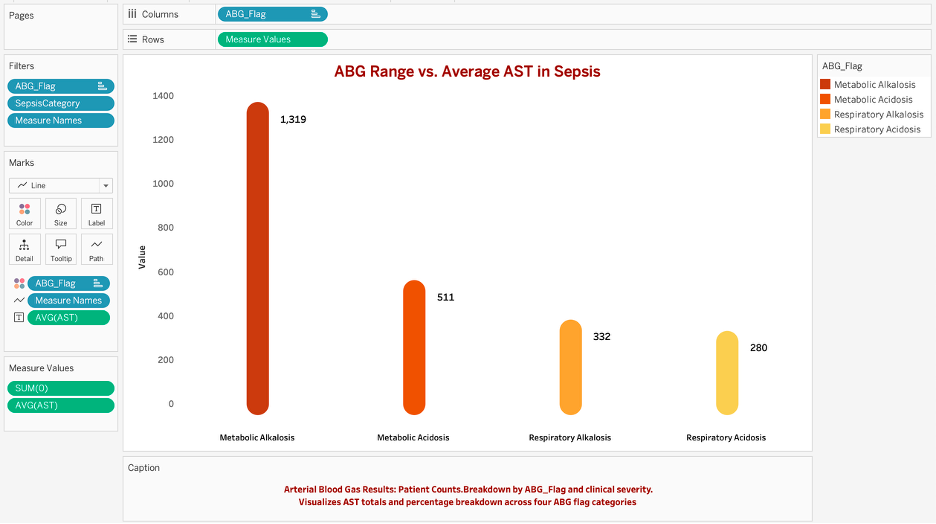
Chart 2: ABG Range vs. Average AST in Sepsis
AST stands for Aspartate Aminotransferase, which is an enzyme found in the liver, heart, and other tissues. It is commonly measured in blood tests to assess liver function or detect liver damage. AST helps detect liver involvement or damage, which can occur in severe sepsis. AST is measured in a separate blood chemistry panel, not in ABG. However, in conditions like sepsis, both ABG and AST may be monitored.
List of calculated fields used in this chart
PH Range
IF [P H] >= 7.35 and [P H] <= 7.45 THEN 'Normal'
ELSEIF [P H] < 7.35 THEN 'Acidosis'
ELSEIF [P H] > 7.45 THEN 'Alkalosis'
END
Hco3 Range
IF [Hco3] >= 22 and [Hco3] <= 26 THEN 'Normal'
ELSEIF [Hco3] < 22 THEN 'Acidosis'
ELSEIF [Hco3] > 26 THEN 'Alkalosis'
END
Paco2 Range
IF [PaCO2] >= 35 and [PaCO2] <=45 THEN 'Normal'
ELSEIF [PaCO2] < 35 THEN 'Alkalosis'
ELSEIF [PaCO2] > 45 THEN 'Acidosis'
END
ABG Flag
IF [PH Range] = 'Acidosis' AND
[Hco3 Range ]='Acidosis' THEN 'Metabolic Acidosis'
ELSEIF [PH Range] = 'Alkalosis' AND
[Hco3 Range ]='Alkalosis' THEN 'Metabolic Alkalosis'
ELSEIF [PH Range] = 'Acidosis' AND
[Paco2 Range ]='Acidosis' THEN 'Respiratory Acidosis'
ELSEIF  [PH Range] = 'Alkalosis' AND
[Paco2 Range ]='Alkalosis' THEN 'Respiratory Alkalosis'
ELSE 'Normal'
END
Sepsis Category
IF ([Sepsis Label]=1
    AND {FIXED [Patient ID]: COUNTD([Sepsis Label])}=1)
THEN 'Sepsis on admisssion'
ELSEIF ([Sepsis Label]=0
    AND {FIXED [Patient ID]: COUNTD([Sepsis Label])}=1)
THEN 'NonSepsis'
ELSE 'OnsetSepsis'
END
ABG RANGE
IF [P H] < 7.35 AND [PaCO2] > 45 AND [Hco3]>=22 AND [Hco3]<=26 THEN 'Respiratory Acidosis'
ELSEIF [P H] > 7.45 AND [PaCO2] < 35 AND [Hco3]>=22 AND [Hco3]<=26 THEN 'Respiratory Alkalosis'
ELSEIF [P H] > 7.45 AND [Hco3] > 26 AND ([PaCO2] <= 45 AND [PaCO2] >= 35) THEN 'Metabolic Alkalosis'
ELSEIF [P H] < 7.35 AND [Hco3] < 22 AND ([PaCO2] <= 45 AND [PaCO2] >= 35) THEN 'Metabolic Acidosis'
ELSE' '
END
To make this Viz in column field drag ABG Flag in row drag Measure Names and in filters add Measure Values, ABG Flag and Sepsis Category
In Measure Value I only take AST Measure Value and Sepsis Category only Sepsis patients (Onset sepsis and Sepsis) and in Mark Card ABG Flag in Color
Key Takeaways
This reinforces that ABG patterns may reflect broader organ dysfunction, yet the chart is descriptive only—it does not adjust for illness severity, shock state, or underlying liver disease. it’s a reminder that lab values rarely exist in isolation; acid–base status and liver enzymes often shift together as part of the systemic response to sepsis. Overall, the chart provides a useful snapshot of associations, not causation, and serves as a starting point for deeper clinical reasoning about multi‑organ involvement in sepsis.
Chart 3: Hourly ABG Abnormalities in Sepsis Patients
List of calculated fields used in this chart
Abnormal ABG
IF ([P H] < 7.35 AND [Hco3] < 22 AND [PaCO2] > 35 AND [PaCO2] < 45) THEN 'Acute Metabolic Acidosis'
ELSEIF ([P H] < 7.35 AND [Hco3] < 22 AND [PaCO2] < 35) THEN 'Partly Compensated Metabolic Acidosis'
ELSEIF ([P H] > 7.35 AND [P H] < 7.40 AND [PaCO2] < 35 AND [Hco3] < 22) THEN 'Compensated Metabolic Acidosis'
ELSEIF ([P H] > 7.45 AND [Hco3] > 26 AND [PaCO2] > 35 AND [PaCO2] < 45) THEN 'Acute Metabolic Alkalosis'
ELSEIF ([P H] > 7.45 AND [Hco3] > 26 AND [PaCO2] > 45) THEN 'Partly Compensated Metabolic Alkalosis'
ELSEIF ([P H] > 7.40 AND [P H] < 7.45 AND [PaCO2] > 45 AND [Hco3] > 26) THEN 'Compensated Metabolic Alkalosis'
ELSEIF ([P H] < 7.35 AND [PaCO2] > 45 AND [Hco3] > 22 AND [Hco3] < 26) THEN 'Acute Respiratory Acidosis'
ELSEIF ([P H] < 7.35 AND [PaCO2] > 45 AND [Hco3] > 26) THEN 'Partly Compensated Respiratory Acidosis'
ELSEIF ([P H] > 7.35 AND [P H] < 7.40 AND [PaCO2] > 45 AND [Hco3] > 26) THEN 'Compensated Respiratory Acidosis'
ELSEIF ([P H] > 7.45 AND [PaCO2] < 35 AND [Hco3] > 22 AND [Hco3] < 26) THEN 'Acute Respiratory Alkalosis'
ELSEIF ([P H] > 7.45 AND [PaCO2] < 35 AND [Hco3] < 22) THEN 'Partly Compensated Respiratory Alkalosis'
ELSEIF ([P H] > 7.40 AND [P H] < 7.45 AND [PaCO2] < 35 AND [Hco3] < 22) THEN 'Compensated Respiratory Alkalosis'
END
Sepsis Label Calc (Calculation)
IF [Sepsis Label]=0 THEN 'Non Sepsis'
ELSE 'Sepsis'
END
Set the Hour (bin) |  |
To achieve this Viz drag Hour Bin into columns and Abnormal ABG into rows. In filters add Sepsis Label Calc (Only Select Sepsis)
From Abnormal ABG and select only below filters
Acute Metabolic Acidosis
Acute Metabolic Alkalosis
Acute Respiratory Acidosis
Acute Respiratory Alkalosis
In mark card drag Patient ID (Distinct Count of Patient_ID)
Mark Card Automatic into Square Shape

Key Takeaways
This chart helps identify which ABG abnormalities are most common and persistent in sepsis.
It supports timing-based decisions—e.g., when to expect resolution or when to recheck ABGs.
It’s a great visual to understand how acid–base disturbances evolve in sepsis.
It reinforces the idea that metabolic acidosis is dominant early, and respiratory patterns are often transient.
Chart 4: Distribution of ABG Conditions Across ICU Stay
List of calculated fields used in this chart
ABG Condition
IF ([P H]<7.35 AND  [PaCO2]>45 AND ([Hco3]>=22 AND [Hco3]<=26)) THEN 'AcuteRespiratoryAcidosis'
ELSEIF ([P H]>7.45 AND  [PaCO2]<35 AND ([Hco3]>=22 AND [Hco3]<=26)) THEN 'AcuteRespiratoryAlkalosis'
ELSEIF ([P H]<7.35 AND ([PaCO2]>=35 AND [PaCO2]<=45 )AND [Hco3]<22) THEN 'AcuteMetabolicAcidosis'
ELSEIF ([P H]>7.45 AND ([PaCO2]>=35 AND [PaCO2]<=45 )AND [Hco3]>26) THEN 'AcuteMetabolicAlkalosis'
END
Sepsis Patients Counts
COUNTD(IF [Sepsis Label] =1 THEN [Patient ID] END)
Set the Iculos (bin) (ICLOS - Intensive Care Length of Stay (ICLOS) ) |  |
This is a stacked area chart showing the percentage distribution of four ABG abnormalities across binned ICU Length of Stay (Iculos) in sepsis patients

Key Takeaways
This chart helps visualize how ABG patterns shift across ICU stay, guiding expectations for acid–base monitoring.
It supports timing-based interventions—e.g., when to anticipate metabolic recovery or respiratory decline.
It’s a great tool to understand dynamic physiology in sepsis.
Reinforces the concept that acid–base disturbances evolve, and their prevalence reflects both disease and treatment effects.
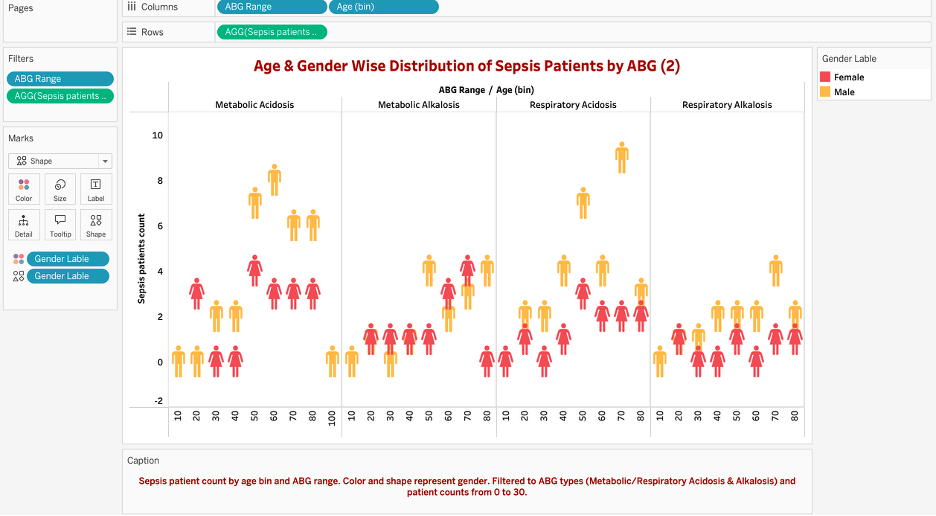
Chart 5: Age & Gender Wise Distribution of Sepsis Patients by ABG
List of calculated fields used in this chart
Gender Label
IF [Gender]=0 THEN 'Female' ELSE 'Male'
END
ABG Range
IF [P H] < 7.35 AND [PaCO2] > 45 AND [Hco3]>=22 AND [Hco3]<=26 THEN 'Respiratory Acidosis'
ELSEIF [P H] > 7.45 AND [PaCO2] < 35 AND [Hco3]>=22 AND [Hco3]<=26 THEN 'Respiratory Alkalosis'
ELSEIF [P H] > 7.45 AND [Hco3] > 26 AND ([PaCO2] <= 45 AND [PaCO2] >= 35) THEN 'Metabolic Alkalosis'
ELSEIF [P H] < 7.35 AND [Hco3] < 22 AND ([PaCO2] <= 45 AND [PaCO2] >= 35) THEN 'Metabolic Acidosis'
ELSE' '
END
Sepsis patients count
COUNTD(IF [Sepsis Label]=1 THEN [Patient ID] END)
Set the Age (bin) |  |
To create this Visualization in Column, Drag ABG Range and Age Bin in Row place sepsis patients count (Average) and in mark card Gender Label in color and Gender label in Shape (I Just add customized shape for Gender Famale and Male shaped image) |  |
In filters section add below fields
ABG Range and exclude Null value
Sepsis Patients Counts
Key Takeaway
This chart helps identify which ABG abnormalities are most common in which age/gender groups.
It supports demographic targeting—e.g., anticipating metabolic acidosis in older male patients.
Reinforces the idea that acid–base disturbances vary by age and gender and are not random.
Encourages thinking about underlying causes—e.g., why older males might be more prone to acidosis in sepsis.
In sepsis patients, metabolic and respiratory acidosis dominate, especially in older males. Alkalosis patterns are less frequent and scattered. This demographic view helps clinicians anticipate ABG abnormalities based on age and gender—but should be interpreted as descriptive, not predictive.
Dashboard Overview
The below picture shows the entire view of ABG Analysis Dashboard

Click here to refer the Tableau public link
Conclusion
This dashboard demonstrates exactly what a real-world clinical dashboard should do combine multiple perspectives, use clean visuals, and tell a meaningful story with data. It shows how to use Tableau for clinical insight, not just pretty charts
This dashboard goes beyond visuals. It helps understand
How to connect data to real clinical meaning
How ABG patterns relate to sepsis severity
How to interpret trends across time, demographics, and organ markers
This is the kind of inspiration that turns beginners into confident dashboard creators.
List of articles referred
Happy Reading!! :)


