Building a Python App for Data Cleaning
- swathi maheshwaram
- Sep 3
- 2 min read

Updated: Sep 3
Data Analysts spend a significant amount of time merging multiple datasets and cleaning them before any meaningful analysis can be performed. Manual cleaning is time consuming and especially when dealing with multiple csv files, missing data, duplicates or inconsistent column formats.
To solve this, i built a streamlit application that automates the merging, cleaning and analysis of datasets.
How I build App and how it Works:
Step 1: Setting up Streamlit
I started by setting up Streamlit as the framework. Streamlit is great because it lets you build data apps quickly, without needing a backend or frontend.

Step 2: File Input
I wanted flexibility, sometimes i work with folder full of files, other times i just want to upload csv files. So I added two modes:
Folder Path+ File Pattern: glob to find files in a folder matching a pattern.
Upload Files ( st.file_uploader )
This way i can merge all patient records(HUPA*P.csv) in one go

Step 3: Handling Missing Values
The tool automatically scans for missing values and lets me decide:
Drop rows.
Fill with median(for numeric data)
Fill with mode(for categorical data)
Keep them as is.
This flexibility means i don't have to hardcode how missing data should be handled. I just pick from a dropdown.

Step 4: Removing Duplicates
Duplicate rows sneak in easily. The app checks for them and shows a preview. With one click, I can drop all duplicates.

Step 5: Column Renaming and Type Conversion
I added options to:
Rename columns interactively, It's quite helpful if file headers are messy.
Convert column types(object to string, date to datetime etc)
This step ensures my dataset has consistent formatting before deeper analysis.


Step 6: Outlier Detection
For numeric columns, I set up manual outlier detection:
Define min/max acceptable values.
Choose whether to remove, cap or keep outliers.
This is especially useful for patient sensor data where extreme values might indicate device errors.

Step 7: Extra Checks
Since I often work with time-series data, I added two specific checks:
Time Span check: Verifies each file covers exactly n days.
Interval check: Ensures timestamp differences are consistent.
These validations saved me from analyzing incomplete or corrupted files.


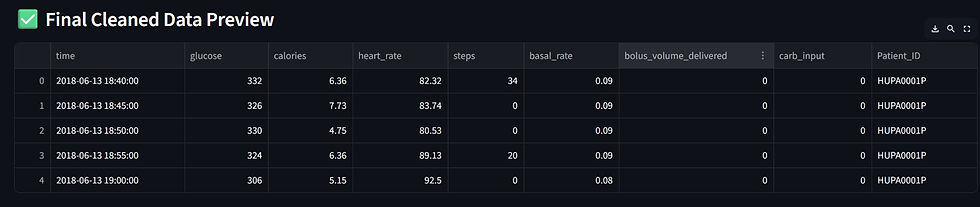
Step 8: Preview, Download and Report
Finally, the cleaned data is displayed in a preview table, and I can:
Download as csv.
See Cleaning summary(list of steps applied)
Get Data Loss Report(Original vs final row count, removed rows)
This transparency is important, as I can always know what transformations were applied.


Conclusion:
This Project turned repetitive cleaning scripts into an interactive app i can reuse for any dataset.
Instead of writing one-off code every time, I now just upload or point to a folder, click through the cleaning steps and instantly get a clean dataset ready for analysis.
The best part is Streamlit made it feel like building a web app without being a web developer.


