Blood Pressure and Diabetes Analytics Dashboard

Why does Blood pressure play an important role in diabetic patients? I had this question when I was given a Diabetes dataset to analyze. In this dataset, patients were assessed for several important biomarkers such as HbA1c, Glucose, fasting glucose, insulin, and other protein biomarkers, which directly play a major role in Diabetes. But I got curious when their Blood Pressure was measured for 24 Hours in each visit. Furthermore, Systolic Blood Pressure, Diastolic Blood Pressure, Mean Blood Pressure, and Heart rate were measured separately during the day and night, and the dip from daytime to nighttime was calculated. That's when I researched and found out that Blood Pressure plays a major role in diabetic patients, because the combination of both causes blood vessel damage. Additionally, diabetic patients are at risk of developing high blood pressure compared to a normal patient. Diabetes damages kidney blood vessels, causing fluid retention and raising blood pressure, while high BP further accelerates kidney and vascular damage.
My next step was to find out how this data supports this fact. To do so, I need to understand the dataset, clean transform, model, and create insights to prove the same. I am going to use Power BI, the most powerful data analytics tool, to present my analysis.
Data definition
To analyse the dataset, first we should understand each data field.
Link to physionet: https://physionet.org/content/cded/1.0.1/
What is this dataset about?
What is the range of values in each column?
What is the normal or permissible range for each biomarker?
What do each of the biomarkers describe?
This dataset is a collection of records based on type 2 Diabetes mellitus impact on other body functioning, such as cognitive, blood pressure, respiratory, laboratory results of blood, retinopathy, and more. So this dataset will be a good input to analyse Blood Pressure vs Diabetes Mellitus. I am going to include only DM/NonDM, Group column, and BP-related columns for my analysis.
Let's start with data definition:
The following table has all the blood pressure-related biomarkers, their definition, range in the dataset, and the expected range of each biomarker. Handling null values in a dataset is a critical step in any data analysis, so I have noted down whether the biomarkers contain any null values. You can see a clear picture of blood pressure-related biomarkers below,
Column Name | Description | Range in Dataset | Expected Range | Null? |
24Hour-Daytime-SBP | Average Systolic Blood Pressure (SBP) during daytime | 96 - 180.75 | 120 - 130 mmHg | Yes |
24Hour-Nighttime-SBP | Average Systolic Blood Pressure during sleep/night | 94.809 - 171 | approximately 110 mmHg | Yes |
24Hour-Daytime-DBP | Average Diastolic Blood Pressure (DBP) during daytime | 53 - 91.77 | 80 mmHg | Yes |
24Hour-Nighttime-DBP | Average Diastolic Blood Pressure (DBP) during sleep/night | 43.38 - 94 | approximately 65 mmHg | Yes |
24Hour-Daytime-MBP | Average Mean Blood Pressure (MBP) during daytime MBP = overall average pressure in arteries | 70 - 115.14 | 70 - 100 mmHg approximately 90mmHg | Yes |
24Hour-Nightime-MBP | Average Mean Blood Pressure (MBP) during night/sleep MBP = overall average pressure in arteries | 62.2 - 117.44, (inconsistent data or outlier) 82075 | 60 - 65 mmHg | Yes |
24Hour-Daytime-HR | Average Heart Rate (HR) during daytime | 52.57 - 103 | 60 to 100 bpm(beats per minute) | Yes |
24Hour-Nightime-HR | Average Heart Rate (HR) during nighttime/sleep | 46.90 - 87.42 | 50 to 75 bpm (beats per minute) | Yes |
24Hour-SBPDIP | Absolute drop in systolic BP at night | -0.244 - 0.228 | 10 - 20 % | Yes |
24Hour-DBPDIP | Absolute drop in Diastolic BP at night | -0.216 - 0.336 | 10 - 20 % | Yes |
24Hour-MBPDIP | Absolute drop in mean BP | -875.635, -0.149 - 0.256 | 10 - 20 % | Yes |
24Hour-HRDIP | Absolute drop in heart rate at night | -0.081 - 0.476 | 10 - 30% | Yes |
24Hour-SBPDIPPER | Percentage(%) drop in systolic BP at night(duplicated column) | -0.244 - 0.228 | 10 - 20 % | Yes |
24Hour-DBPDIPPER | Percentage(%) drop in diastolic BP at night(duplicated column) | -0.216 - 0.336 | 10 - 20 % | Yes |
24Hour-MBPDIPPER | Percentage(%) drop in mean BP(duplicated column) | -875.635, -0.148 - 0.256 | 10 - 20 % | Yes |
To understand my biomarkers, I referred to a few websites, given the link below.
Data cleaning/Transformation and Modelling
Data cleaning is one of the most important steps in data analysis because raw data are very rarely perfect.
So, data cleaning is the next step in the data analysis.
Removing duplicated column
Checking for the datatype of each field
Remove/Replace null values
Fixing outliers
Data cleaning can be done using the Power Query editor in Power BI

Power Query Editor is an inbuilt tool available in Power BI - it helps to transform data Data cleaning steps performed on the Diabetes mellitus group column - removed the extra DM, Non DM column, and added DM and CONTROL in the Group column

The following are the cleaning steps performed on the Blood pressure biomarkers as part of data cleaning.
Name | Colomn Name | Changes Made | |
Blood Pressure monitoring data for every subject in Visit 2 and Visit 8 | |||
24Hour-Daytime-SBP | 1. Renamed the column name 2. Changed the decimal 2 places | ||
24Hour-Nighttime-SBP | 1. Renamed the column name 2. Changed the decimal 2 places | ||
24Hour-Daytime-DBP | 1. Renamed the column name 2. Changed the decimal 2 places | ||
24Hour-Nighttime-DBP | 1. Renamed the column name 2. Changed the decimal 2 places | ||
24Hour-Daytime-MBP | 1. Renamed the column name 2. Changed the decimal 2 places | ||
24Hour-Nightime-MBP | 1. Renamed the column name 2. Replaced outlier value with null to prevent inconsistency in the dataset or misleading results in further analysis 3. Changed the decimal 2 places | ||
24Hour-Daytime-HR | 1. Renamed the column name 2. Changed the decimal 2 places | ||
24Hour-Nightime-HR | 1. Renamed the column name 2. Changed the decimal 2 places | ||
24Hour-SBPDIP | 1. Renamed the column name 2. Changed the decimal 3 places | ||
24Hour-SBPDIP | 1. Renamed the column name 2. Changed the decimal 3 places | ||
24Hour-MBPDIP | 1. Renamed the column name 2. Changed the decimal 3 places | ||
24Hour-HRDIP | 1. Renamed the column name 2. Changed the decimal 3 places | ||
24Hour-SBPDIPPER | Removed this duplicated column | ||
24Hour-DBPDIPPER | Removed this duplicated column | ||
24Hour-MBPDIPPER | Removed this duplicated column | ||

During modelling, we transformed the dataset into Fact table and Dimension tables- Dim_Demographics, Dim_Medical_History, and Dim_Risk_Category to establish a Star schema. This helps to improve performance, eliminate redundancy, and make analysis and reporting easier.

The blood pressure-related columns are placed under the Fact table, along with other numerical data. All the descriptive and categorical columns are placed in the respective dimension tables as shown in the image above.
It is essential to create categorical columns to improve our analysis. Based on the daytime BP and nighttime BP, their dip values are calculated, and dipper categories are calculated.
We always need to fix the datatype of the newly created column to the accurate datatype, otherwise it will be ABC123 | |
24Hour-SBPDIP_Category | 1. Based on 24Hour-SBPDIP, categorized into 4 groups - Reverse Dipper(if it is less than 0) - Non Dipper (if less than 10) -Normal Dipper(if less than 20) -Extreme Dipper (if greater than 20) -Unknown (if null) 2. Fixed the Data type to TEXT |
24Hour-DBPDIP_Category | Based on 24Hour-SBPDIP, categorized into 4 groups - Reverse Dipper(if it is less than 0) - Non Dipper (if less than 10) -Normal Dipper(if less than 20) -Extreme Dipper (if greater than 20) -Unknown (if null) 2. Fixed the Data type to TEXT |
24Hour-MBPDIP_Category | Based on 24Hour-MBPDIP, categorized into 4 groups - Reverse Dipper(if it is less than 0) - Non Dipper (if less than 10) -Normal Dipper(if less than 20) -Extreme Dipper (if greater than 20) -Unknown (if null) 2. Fixed the Data type to TEXT |
24Hour-HRDIP_PER | 1. calculated percentage of heart rate dippers 2. Fixed the Data type to TEXT |
24Hour-HRDIP_Category | Based on 24Hour-HRDIP, categorized into 4 groups - Reverse Dipper(if it is less than 0) - Non Dipper (if less than 10) -Normal Dipper(if less than 20) -Extreme Dipper (if greater than 20) -Unknown (if null) 2. Fixed the Data type to TEXT |
These dipper categorical columns are placed in the Dim_Risk_Category table.

DAX
Data Analysis Expressions is a query language used in Power BI, a powerful language that makes a data analyst's job easy in many ways. It helps us build custom calculations such as calculated columns, calculated parameters, and perform complex aggregations, which generate analytical insights. It is used in other Microsoft-developed platforms, too.
During the analysis, I used DAX to create a calculated column, "BP Classification," based on daytime SBP(Systolic Blood Pressure) and DBP(Diastolic Blood Pressure).
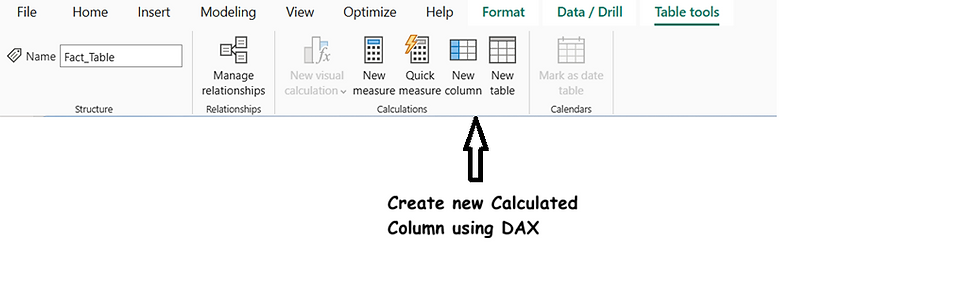
Steps followed while creating the calculated fields:
- Used VAR to store SBP and DBP values
- Used nested IF() to assign category row by row
Category | SBP | DBP |
Normal | <=120 | or <=80 |
Elevated | 120-129 | or <80 |
Stage 1 Hypertension | 130-139 | or 80-89 |
Stage 2 Hypertension | >=140 | or >=90 |
Hypertensive Crisis | >180 | or >120 |
The formula used to categorize BP

Data Visualization
Now, we have all the data perfectly to show our analysis of the impact of Blood pressure on Diabetes Mellitus.

Diabetes Mellitus (DM) and CONTROL patients are classified into five BP categories:1. Normal, 2. Elevated, 3. Stage 1 Hypertension, 4. Stage 2 Hypertension and 5. Hypertensive Crisis. Each bar in this chart shows how many patients fall into each group.
BP Category | Control | DM |
Normal | 13 | 7 |
Elevated | 9 | 6 |
Stage 1 Hypertension | 20 | 28 |
Stage 2 Hypertension | 7 | 11 |
Hypertensive Crisis | 0 | 1 |
Notably, there are no cases of the Hypertensive Crisis category in the CONTROL patients, indicating that no severe classification of BP appears at all. The normal category is proportionally smaller in the DM group. Moreover, Stage 1 Hypertension and Stage 2 Hypertension show more numbers in the DM group. Altogether, this reinforces that the DM group patients show higher severity of blood pressure categories with fewer falling in the normal blood pressure category, compared to the CONTROL group of patients. Also, more patients fall into the Stage 1 and Stage 2 Hypertension categories, indicating that diabetes brings cardiovascular risk burden in this population, and reinforces that BP monitoring is essential.

This chart compares systolic and diastolic blood pressure between two patient groups, DM and CONTROL. The dashed line marks the clinical thresholds of 140 mmHg for systolic and 90 mmHg for diastolic, which show the standard cutoffs for diagnosing hypertension.
Looking at the left panel, we could see a well-clustered set of data points, with most CONTROL patients falling under Normal to Stage 1 Hypertension. Very few data points on the Stage 2 Hypertension and no Hypertension crisis in the CONTROL patients.
In the other case, the right panel, we could see that most DM patients show Stage 1 Hypertension. Comparatively, more Stage 2 Hypertension and one Hypertension Crisis red data point are being noted in patients with Diabetes Mellitus.
Based on our observation, diabetic patients show wider blood pressure spread and threshold exceedance than controls across both systolic and diastolic. This highlights the well-established clinical relationship between diabetes and elevated cardiovascular risk. Hence, blood pressure monitoring and management are critical in diabetic patients.

This chart compares nocturnal blood pressure dipping patterns between the CONTROL and DM group patients across both systolic and diastolic measurements. Both groups show a similar high number of Extreme Dippers, but the most concerning finding is in the Reverse Dipper category. DM patients show more than double the number of Reverse Dippers in systolic readings (5 vs 13) and triple in diastolic readings (2 vs 7). Usually, the BP has to dip while sleeping or resting, but in Reverse Dippers, the BP rises, which causes cardiovascular risk in diabetic patients, proving that 24-hour ambulatory BP monitoring is needed beyond standard daytime readings.

Based on the insight from the above dashboard let's find the answer to my question, "Why is blood pressure management critical in DM Patients?"
Diabetes and hypertension are a dangerous combination at any age. Diabetes damages blood vessel walls and impairs the autonomic nervous system regulation, which disrupts the normal overnight BP dip. Chronically elevated BP then accelerates the complications diabetes already promotes, such as kidney disease, retinopathy, neuropathy, heart attack, and stroke. The data here shows us DM patients are not only more hypertensive during the day, but their blood pressure fails to recover overnight, indicating their cardiovascular system is under stress around the clock. Hence, BP monitoring and control are not a secondary concern in diabetic patients; it is a high-priority factor equal to blood glucose management.


