ABG Analysis in Sepsis Patients using Packed Circle Chart in Tableau

An arterial blood gas (ABG) test is a blood test that requires a sample from an artery in your body to measure the levels of oxygen and carbon dioxide in your blood. The test also checks the balance of acids and bases, known as the pH balance, in your blood.
Your body normally tightly regulates the amount of oxygen and carbon dioxide in your blood, because low blood oxygen levels can lead to many serious conditions and damage to individual organ systems, especially your brain and heart.
In this blog, I present an interactive ABG classification Packed circle chart built in Tableau, designed to offer intuitive visual insight into the distribution of acid-base disorders in a sepsis dataset.
What is measured in an arterial blood gas test?
Partial pressure of carbon dioxide (PaCO2): This measures the amount of carbon dioxide in your blood and how well carbon dioxide can move out of your body.
pH: This measures the balance of acids and bases in your blood, known as your blood pH level. The pH of blood is usually between 7.35 and 7.45. If it’s lower than that, your blood is considered too acidic. If it’s higher than that range, your blood is considered too basic (alkaline).
Bicarbonate (HCO3): This is calculated using the measured values of pH and PaCO2 to determine the amount of the basic compound made from carbon dioxide (CO2.)
Normal ranges :
pH: 7.35 - 7.45
PaCO2: 35-45 mmHg
Bicarbonate (HCO3): 22-26 mEq/L
Metabolic Acidosis: When the pH and HCO3 are below the normal range and PaCO2 is normal, it is called Metabolic Acidosis.
Metabolic Alkalosis: When the pH and HCO3 are above the normal range and PaCO2 is normal, it is called Metabolic Alkalosis.
Respiratory Acidosis: When the pH is below the normal range, PaCO2 is above the normal range and HCO3 is normal, it is called Respiratory Acidosis.
Respiratory Alkalosis: When the pH is above the normal range, PaCO2 is below the normal range and HCO3 is normal, it is called Respiratory Alkalosis.
With above information let’s make packed bubble chart.
Step by Step Process :
First, we need to make some calculated fields.
HCO3 range

PaCO2 range

pH range

ABG range

To make this packed circle chart, I used union method.

Next step is creating a path.

To create path bin right click on the Path_PC and create bins and set bin size as 1.

Now create a calculated field as Index_PC to add values

Create a calculated field as Total_Patient_PC. For this I’m using Window_Max function.

Let’s create two more calculated fields for X and Y axis


Let’s bring all calculated fields to respective places so that we have our desired chart. Drag X_PC to columns, Y_PC to rows and Path_PC(bin) to detail. Then right click to X_PC and Y_PC, compute using to Path_PC(bin) as shown below.

Then you get below image.

Now drag ABG range in color and filters, and avoid null, as shown below.

So you will get below image.

Now edit X and Y axis.


And again, right click to X_PC and Y_PC, compute using to Path_PC(bin). So, you get below image.

To get proper circles, change the chart type to ‘Line’ under the Marks label. Add ‘Path_PC(bin)’ field to ‘Path’ under marks card.

Now change chart type ‘Polygon’ under Marks label. To see each circle, under Marks label, right click to ABG_Range1 and select sort. Then Sort by Manual with Ascending order shown as below.

So now we get below image.
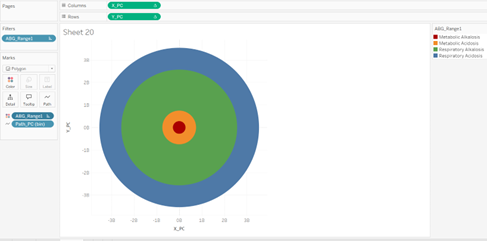
Now adjust Y axis to make more attractive. For that we need to update Y_PC calculated field as below.

So we get Packed circle as shown below figure.

Now to make this chart more attractive, I added another Y_PC calculated field to the rows.

In Y_PC(2), change chart type to line, and in Y_PC reduce opacity to 40%


Now make dual axis.

So almost we done, little formatting is remaining.

After removing grid lines, headers and everything we get final chart as below.

From above chart we can conclude that,
· Respiratory acidosis is the most significant disturbance in sepsis patients.
· Respiratory alkalosis is also common, likely representing the early stages or compensation.
· Metabolic disturbances (acidosis/alkalosis) are less frequent but still relevant.
Abnormal ABG values, especially in patients with sepsis, can be an important prognostic indicator, for example, respiratory acidosis has been associated with higher mortality rates in sepsis patients. ABG analysis can help clinicians identify patients who are at higher risk of complications and mortality.
ABG analysis is a cornerstone in the management of sepsis patients, providing critical insights into acid-base status, oxygenation, and ventilation. Metabolic acidosis, often due to lactic acidosis, is the dominant abnormality, while respiratory acidosis carries the worst prognosis. Serial ABG measurements, combined with lactate trends, APACHE II scores, and clinical assessment, help guide treatment and predict outcomes. Despite its utility, ABG analysis should be interpreted cautiously, considering its limitations and the dynamic nature of sepsis. A systematic approach to ABG interpretation, coupled with a deep understanding of sepsis pathophysiology, is essential for optimizing patient care.


