A Comprehensive Guide to Calculated Fields, Filters, and Parameters in Tableau:
Tableau is one of the most used visualization tools around the world. It has many different features within it, which make analyzing and visualizing the data easier.
When I started learning Tableau, I was excited and began building all kinds of simple charts. I enjoyed creating different types of dashboards. But when I went a little deeper, that’s when the real fun began! I learned how to create calculated fields, how to use filters and parameters, and how to build interactive dashboards. That’s when I truly started to appreciate the power of Tableau.
When I explore data in Tableau, three tools often come up: Calculated Fields, Filters, and Parameters. Each plays a different role in shaping our dashboard. Let’s understand how they work.
Let’s break them down with clear examples so you can start using all three like a pro.
1. What is a Calculated Field?
Sometimes our source does not contain a field (or column) that we need for our analysis, so we need to create a calculated field.A calculated field allows us to create new data by using a formula. Think of it as building a new column or value that doesn’t exist in your original dataset.
Example:
We have a column Gender in our dataset with rows 0 and 1. We can make a new column for males and females.
IF [Gender]=0 THEN 'Female'
ELSE 'Male'
END
We have data related to age, but we want to make a separate column for minors, adults, and the elderly. Then we need to make a calculated field

What is a Filter in Tableau?
It allows us to choose which data should be included or excluded from your view. Filters play a major role while analyzing data. They can restrict the amount of data according to the requirements. That could be very helpful in driving insights from the data and visualizing them.
In simple words, Filters help you control what you want to see on your dashboard or chart.
Example:
In our dataset, we have three types of patients based on their sepsis condition:
Non-Sepsis, Onset Sepsis, Sepsis on Arrival
First, we create the calculated field and drag the field Filters shelf.
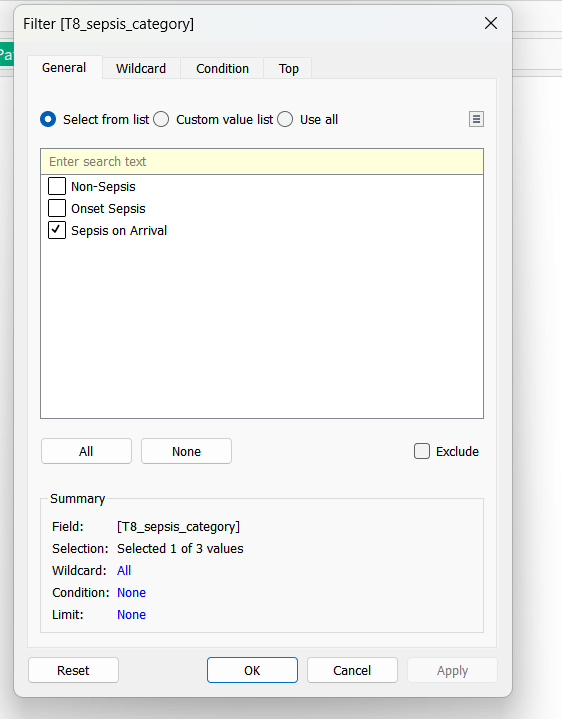
Tableau will open a window showing all the available categories: Non-Sepsis, Onset Sepsis, and Sepsis on Arrival.
You can check the boxes for the categories you want to show.
Only show "Sepsis on Arrival" patients.
Show Filter on Dashboard:
Go to the Dashboard tab (or create a new one).
Drag your worksheet into the dashboard.
Click on the worksheet in the dashboard to select it.
In the top menu, click "Dashboard" > "Filters", then choose the field (e.g., Patient Type) you want to show as a filter.
Now the filter will appear on your dashboard.
Parameters:
In Tableau, a parameter is a dynamic input that allows users to interact with and modify visualizations. Unlike filters, which directly limit data displayed, parameters are versatile variables that can be used in calculations, filters, reference lines, and more.
The parameters in Tableau are the manual workbook factors like a number, date, or determined field that permits users to substitute a constant value in a calculation, filter, or reference line.
How to Create a Parameter in Tableau
1. Create the Parameter:
o In the Data pane, click the drop-down arrow and select Create Parameter.
o In the dialog box, provide a name, select the data type (e.g., integer, float, string, date), and define allowable values (e.g., list, range, or all.

1. Use the Parameter:
o Incorporate the parameter into a calculated field, filter, or reference line to control aspects of the visualization dynamically.
2. Show Parameter Control:
o Right-click the parameter in the Data pane and select Show Parameter to display a control on the worksheet or dashboard, allowing users to adjust the parameter's value interactively.
Common Use Cases for Parameters
Dynamic Thresholds: Allow users to set custom thresholds for metrics like sales targets.
Measure or Dimension Switching: Enable toggling between different measures (e.g., sales vs. profit) or dimensions (e.g., region vs. category).
Top N Filters: Let users define how many top-performing items to display.
Reference Lines: Adjust reference lines dynamically based on user input.
Parameters vs. Filters
Filters and parameters are built in Tableau to view the data based on endless conditions that can shift as per your needs. The following are a few essential differences between filters and parameters.
In Tableau, filters and parameters are both tools used to control the data displayed in your visualizations, but they serve different purposes and have distinct functionalities. Here's a detailed comparison to help you understand their differences:
Filters
Purpose: Filters are used to include or exclude data from your visualizations based on specific criteria.
Key Characteristics:
Data-Dependent: Filters are directly tied to the data source. They allow you to display only the data that meets certain conditions.
Multi-Select Capability: Filters can be configured to allow multiple selections, enabling users to view data for several categories simultaneously.
Scope: By default, filters are applied at the worksheet level but can be extended to dashboards or across multiple worksheets.
Use Cases: Ideal for narrowing down data to specific regions, time frames, categories, etc.
Parameters
Purpose: Parameters are dynamic values that can replace constant values in calculations, filters, or reference lines, allowing for more interactive and flexible visualizations.
Key Characteristics:
Data-Independent: Parameters are not tied to the data source. They are user-defined and can take on a single value at a time.
Single-Select Only: Parameters accept only one value at a time, which can be a number, date, or string.
Scope: Parameters are workbook-level entities, meaning they can be used across multiple worksheets and dashboards within the same workbook.
Use Cases: Useful for creating dynamic calculations, switching between measures or dimensions, setting thresholds, or controlling reference lines.
Comparison Table
Feature | Filter | Parameter |
Data Dependency | Tied to data source | Independent of data source |
Selection Type | Multi-select | Single-select |
Scope | Worksheet-level (can be extended) | Workbook-level |
Use in Calculations | Limited (primarily for filtering data) | Extensive (can drive calculations and logic) |
Interactivity | Directly filters data displayed | Controls dynamic elements like calculations |
Common Use Cases | Filtering data by category, date, region, etc. | Switching metrics, setting thresholds, etc. |
When to Use What?
Use Filters when you want to allow users to narrow down the data displayed based on specific criteria directly tied to the data source.
Use Parameters when you need to create dynamic and interactive elements in your dashboard, such as allowing users to switch between different metrics or input custom values for calculations.
Understanding the distinct roles of filters and parameters in Tableau enables you to build more interactive and user-friendly dashboards. By leveraging both tools appropriately, you can provide users with powerful ways to explore and analyze data.


